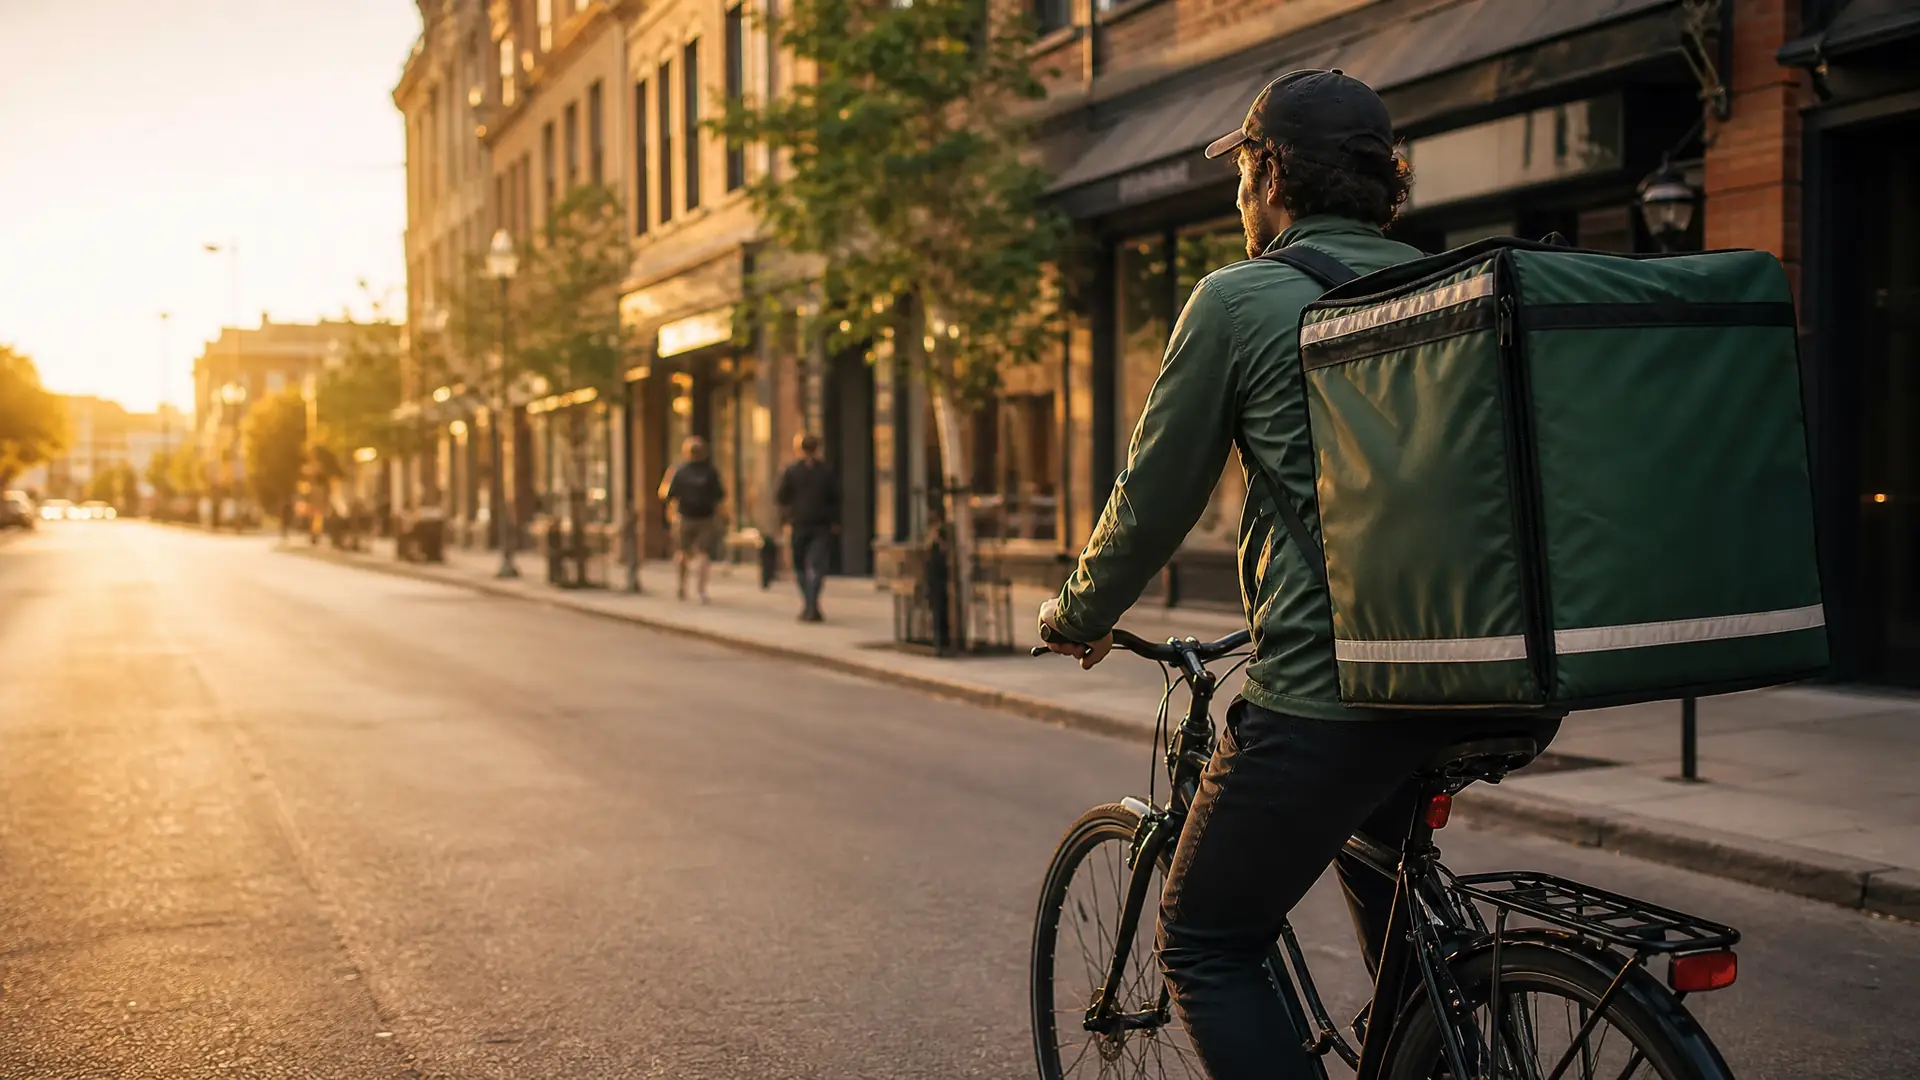
Food delivery courier on a bicycle in a city street at golden hour

MealCraft

Business plan · 2026 — 2029

Good food,
delivered right.

MealCraft is a food delivery service built for a medium-sized city where demand is growing — and competition hasn't arrived yet.

Explore the plan Prepared for investors · March 2026
MealCraft · Food Delivery · Business Plan Launch · Q3 2026

Executive summary

The opportunity,
in four numbers.

0k metro population — underserved by delivery
0% annual food-delivery demand growth (est.)
0 majors national delivery platforms currently active in the city
$0M projected revenue, year 3 (2029)

MealCraft enters a city with 420k people, 1,200+ restaurants and growing delivery demand — before the national platforms do. Delivery fee + restaurant commission model. Break-even by month 15. $1.9M revenue in year 3.

Market gap

Demand is here.
Supply isn't.

  • 1,200+

    Restaurants — a rich, diverse food scene with almost no delivery infrastructure.

  • 34%

    Demand growth — driven by a young professional population and a university of 38k students.

  • 0

    Active majors — national platforms deprioritized mid-size cities; coverage is spotty at best.

  • 45 min

    Average wait — the current alternative is phone orders and 45+ minute pickup waits.

Delivery demand vs supply index, by city tier
Big metros Demand 95 Supply 100 Medium city Demand 85 Supply 25 ■ demand ■ supply

GAP

The biggest demand/supply mismatch in the region — a market ready for a local player.

Target audience

Three segments,
one platform.

Young professionals

18–35, time-poor, tech-native. Order 2–3×/week, prefer speed and app UX.

· 38% of orders
University students

38k students on two campuses. Price-sensitive, group orders, late-night peak.

· 29% of orders

Families

Weekend orders, larger baskets, high loyalty. Care about reliability over speed.

· 24% of orders

+ the restaurants

120+ partner restaurants onboarded in year 1 — the supply side is the moat: exclusive local delivery = higher margins for them, loyalty for us.

· 120 partners · year 1

Revenue model

Two streams,
one flywheel.

01

Delivery fee

$2.90 avg / order

  • Paid by the customer per order
  • Distance-based tiers: $1.90 / $2.90 / $3.90
  • Free delivery over $25 basket (retention hook)
02

Restaurant commission

15% avg per order

  • Charged to partner restaurants
  • 12% launch rate → 18% by year 3
  • Local-exclusive deals justify the rate
03

Mix & growth levers

2.1 orders / active user / mo

  • Promoted listings & featured placement
  • Subscription tier (free delivery, $4.99/mo)
  • Corporate lunch accounts

Unit economics (month 18): avg order value $18.50 · delivery fee $2.90 · commission $2.78 · revenue per order ≈ $5.68 · variable cost per order ≈ $3.10 → ≈ $2.58 contribution per order.

Operations
Local, fast,
sustainable.

45 mintarget delivery time · city-wide
60 couriersflexible fleet by year 1 · bicycle + car
3delivery zones · optimized routes
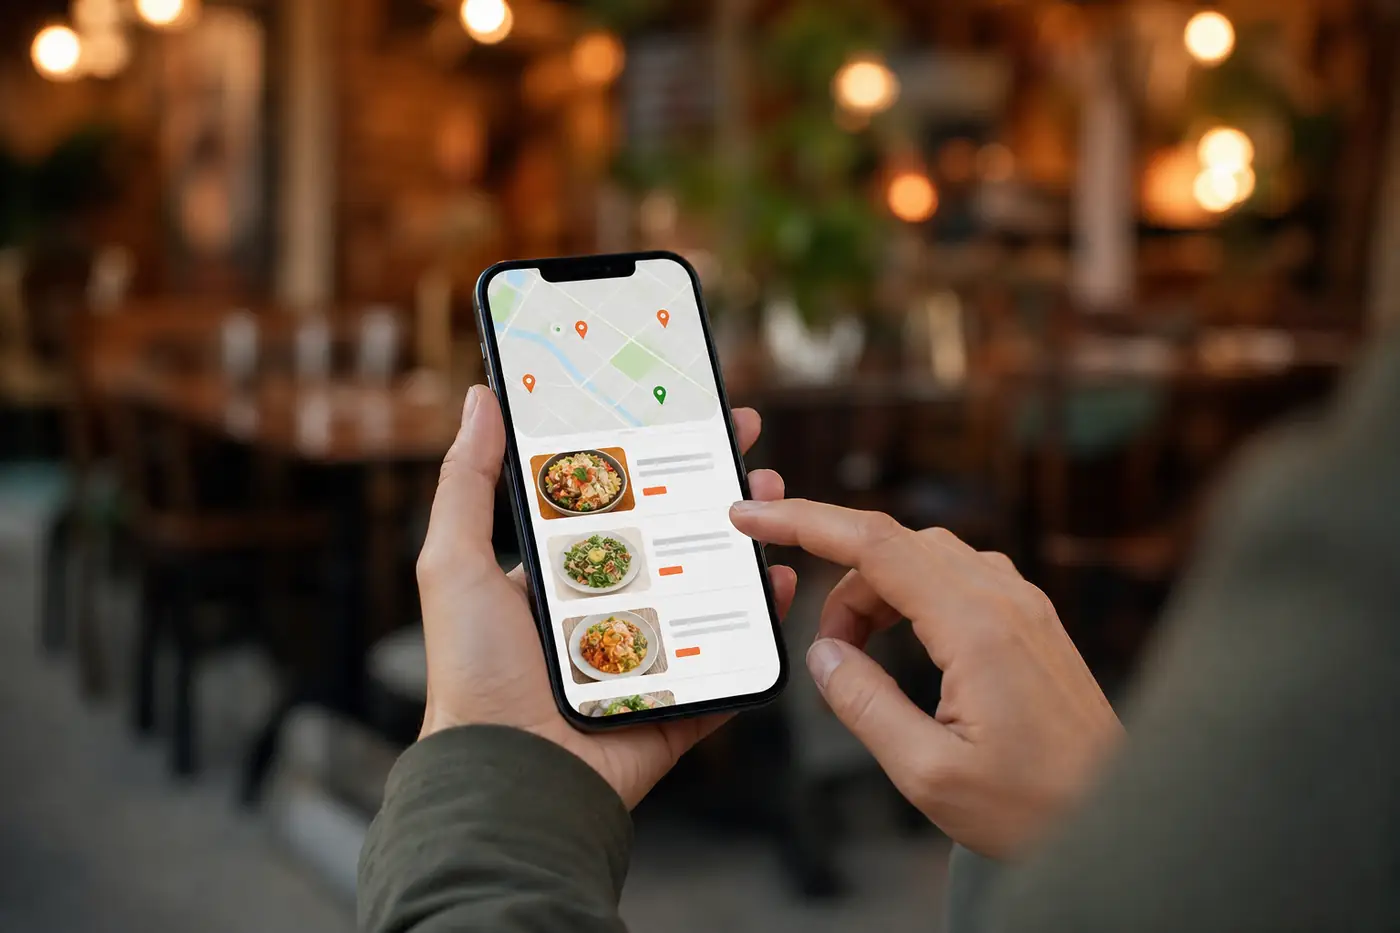
AppiOS + Android · live tracking · in-app chat
11–14 hdaily window · lunch + dinner peaks
0 fleetasset-light: no warehouses, no kitchens
Hands holding a phone with a food delivery app, restaurant interior blurred behind
The app — order, track, rate

delivery promise

"Hot in 45, or it's free" — a simple guarantee that builds trust in a market that's never had it.

Growth strategy

Three years.
Three chapters.

Y1

Launch in the city core. 40 partner restaurants. 8,000 app downloads. 45-min promise as the brand.

Y2

City-wide coverage. 120 partners. Subscription tier. Break-even by month 15.

Y3

Second city. Corporate lunch program. Positive EBITDA; revenue $1.9M.

Financial projections

The numbers
that close the case.

$0kRevenue · Year 1
$0kRevenue · Year 2
$0kRevenue · Year 3
+$0kEBITDA · Year 3
Revenue & EBITDA trajectory, 2026 — 2029 ($k)
202620272029 ▲ revenue ■ EBITDA

Funding ask

$500k to
own the city.

Platform & app build
$170k
Launch marketing & incentives
$120k
Fleet, uniforms & insurance
$90k
Operations runway (12 mo)
$80k
Contingency (10%)
$40k
Total ask $500k · equity 20%

What $500k buys

  • A working app + courier ops in 90 days
  • 40 exclusive partner restaurants at launch
  • 8,000 downloads and 30% repeat rate by Q4
  • Break-even by month 15, without a second raise

Use of funds covers the full runway to profitability — not just a pilot.

Risks & mitigation

We know what
could go wrong.

RiskMitigation
A national platform enters Local-exclusive restaurant deals · speed promise · community brand — incumbents can't match a local moat.
Demand slower than projected Asset-light model: variable courier fleet, no fixed kitchens. Costs flex with demand; break-even is adjustable.
Courier supply & reliability Flexible shifts, mileage bonus, 4.5★ courier rating system, and a full-time core of 15 couriers from day one.
Commission pushback Launch at 12% (below national norms), exclusive-local positioning, and delivery volume as the value prop.

Market context

The city, by the numbers.

0k metro population · #34 largest metro in the state
0k university students · two campuses, 24/7 demand
0+ restaurants · diverse cuisine, underserved delivery
$0B US food delivery market 2026 · growing 12%/yr

Mid-size cities are the untapped layer of food delivery: national platforms chase the top-10 metros, leaving 420k people to phone orders and 45-minute waits. That's the gap MealCraft exists to fill.

The ask

Fund the city
that's ready.

$500k · 20% equity · break-even month 15 · $1.9M revenue by year 3. The demand is here — the platform isn't. Yet.

01

Build · app + ops · Q3 2026

02

Launch · 40 partners · Q4 2026

03

Scale · city-wide · 2027

04

Expand · 2nd city · 2029

MealCraft · [email protected] · Prepared with Loom — AI-assisted business planning

← → to navigate · F for fullscreen

Criado comEntelecy